Financial Reports Every Business Needs: A Complete Guide
Business Finances Series
This guide is part of a comprehensive series. Explore all 16 topics:
Financial reports are your business's dashboard—they tell you where you are, where you've been, and help you decide where to go. Yet many small business owners avoid these critical documents, finding the numbers intimidating or the formats confusing. This avoidance comes at a steep cost: missed opportunities to optimize pricing, late detection of cash flow problems, and difficulty securing loans or investment when you need capital to grow.
The good news? You don't need an accounting degree to understand and use financial reports effectively. Once you grasp what each report measures and why it matters, you'll wonder how you ever ran your business without them. This comprehensive guide walks you through every essential financial report, explains how to read and interpret the numbers, and shows you how to use these insights to make smarter business decisions.
The Three Core Financial Statements
Three fundamental reports form the foundation of business financial analysis.
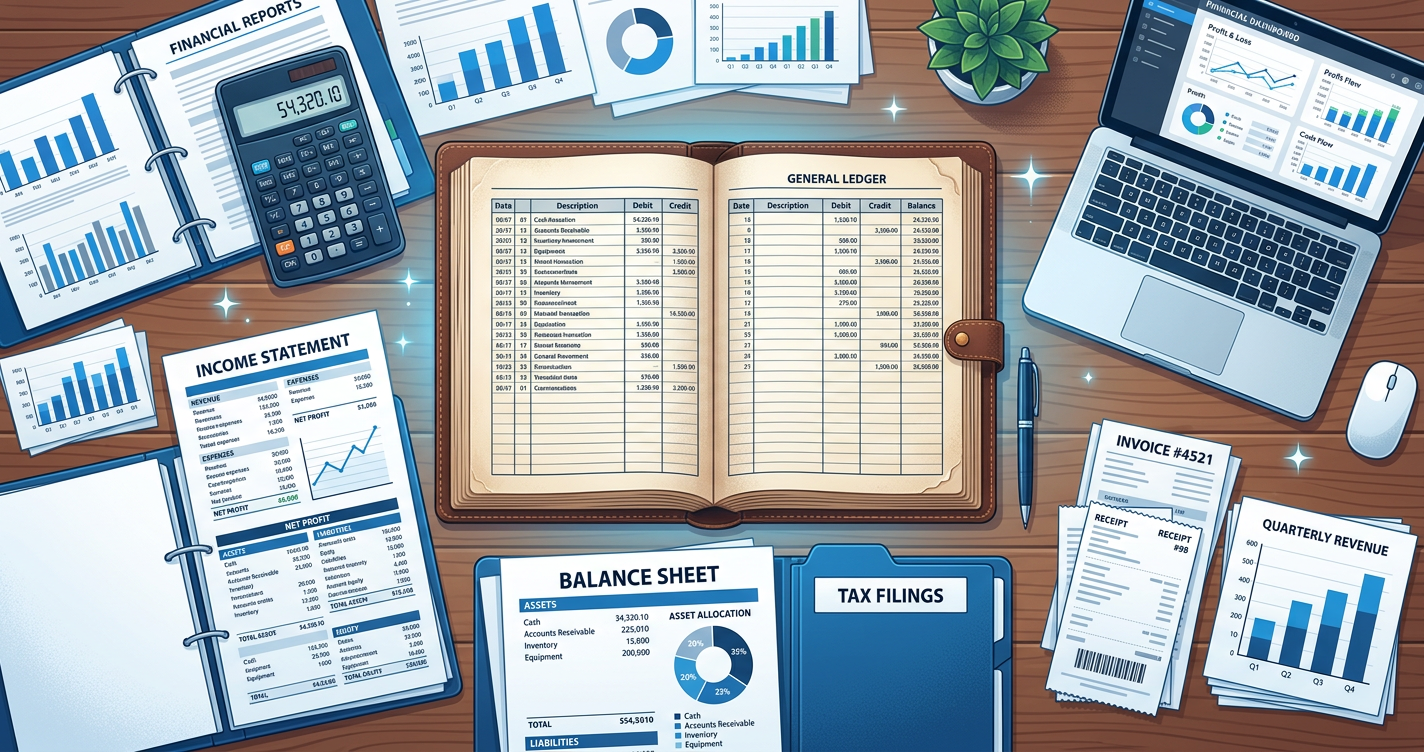
Three fundamental reports form the foundation of business financial analysis. Think of them as the vital signs of your company's health. The Profit and Loss Statement tells you if you're making money, the Balance Sheet reveals your financial position at a point in time, and the Cash Flow Statement tracks where your money actually goes. Together, they provide a complete picture that no single report can offer alone.
Every lender, investor, and potential buyer will ask for these three reports. More importantly, reviewing them regularly helps you spot trends, identify problems early, and make data-driven decisions instead of operating on gut instinct.
The Profit and Loss Statement (Income Statement)
What it tells you: Did you make or lose money over a specific period of time?
What it tells you: Did you make or lose money over a specific period of time?
The P&L statement—also called an income statement or statement of earnings—summarizes your revenue earned and expenses incurred during a specific period, typically a month, quarter, or year. It answers the fundamental question every business owner asks: "Am I profitable?"
Key Line Items on Your P&L
- Gross Revenue (Sales): Total income from your products or services before any costs are subtracted. This is your top-line number.
- Cost of Goods Sold (COGS): Direct costs to produce what you sell—materials, direct labor, manufacturing costs. Service businesses may have minimal COGS.
- Gross Profit: Revenue minus COGS. This tells you how much you make on each sale before overhead expenses.
- Operating Expenses: Rent, utilities, salaries, marketing, insurance, software subscriptions—everything required to run the business beyond direct product costs.
- Operating Income (EBIT): Gross profit minus operating expenses. This is profit from your core business operations.
- Net Income: The bottom line after all expenses, taxes, and interest. This is what you actually keep.
How to Read Your P&L Statement
Don't just look at the bottom line—analyze the ratios and trends:
Don't just look at the bottom line—analyze the ratios and trends:
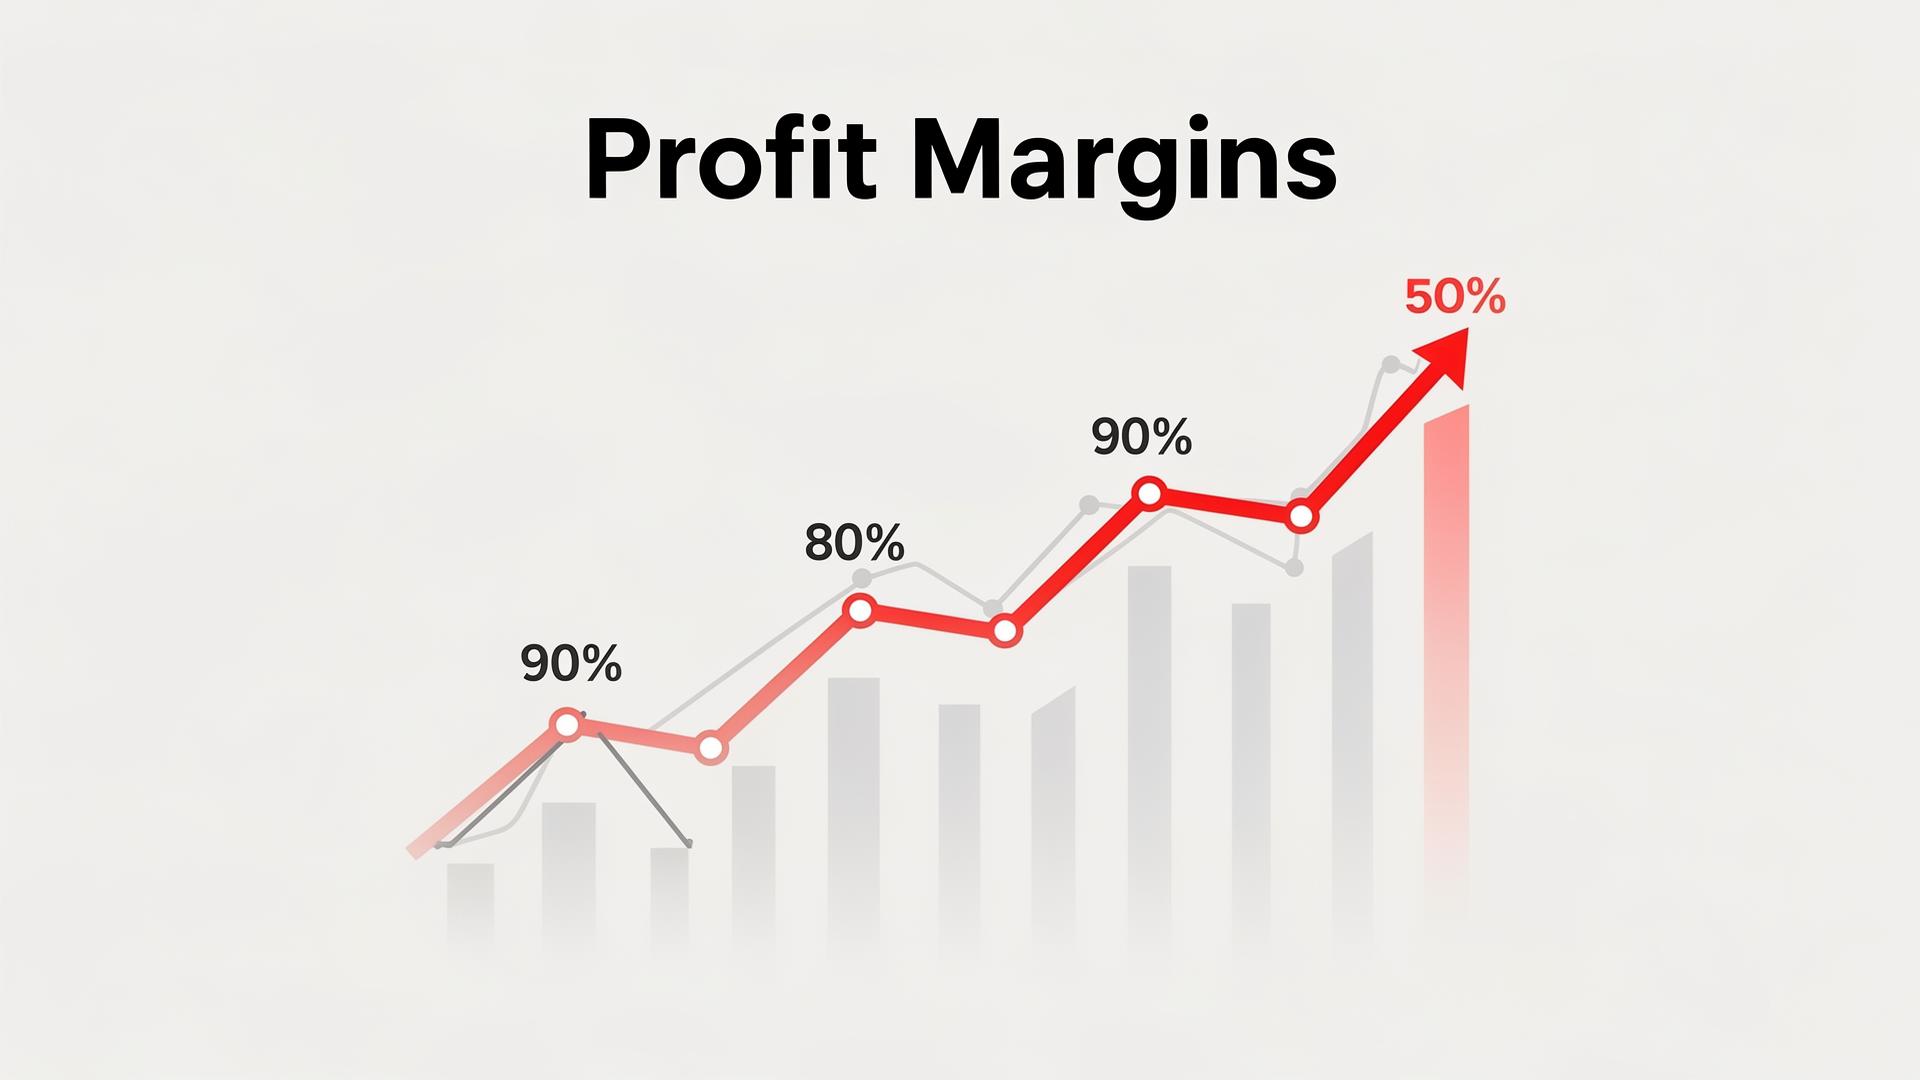
- Gross Profit Margin: (Gross Profit ÷ Revenue) × 100. For most service businesses, this should be 50-80%. Retail might be 25-50%. If your margin is declining, investigate pricing or supplier costs.
- Operating Expense Ratio: (Operating Expenses ÷ Revenue) × 100. Track this monthly—a creeping ratio means expenses are growing faster than revenue.
- Net Profit Margin: (Net Income ÷ Revenue) × 100. Compare to industry benchmarks. Most small businesses target 10-15%.
Compare periods: A single P&L tells you little. Compare this month to last month, this quarter to last quarter, and this year to last year. Look for patterns: seasonal dips, growth trends, or sudden expense spikes that need investigation.
Red Flags to Watch For
- Declining gross profit margin (rising costs or pricing pressure)
- Operating expenses growing faster than revenue
- Net income positive but declining quarter over quarter
- One expense category suddenly spiking without explanation
The Balance Sheet
What it tells you: What do you own, what do you owe, and what's your net worth at a specific point in time?
What it tells you: What do you own, what do you owe, and what's your net worth at a specific point in time?
Unlike the P&L which covers a period, the balance sheet is a snapshot of a single moment—typically month-end, quarter-end, or year-end. It follows the fundamental accounting equation: Assets = Liabilities + Owner's Equity. If this equation doesn't balance, something is wrong with your books.
Understanding Assets
Assets are everything your business owns that has value:
- Current Assets: Cash, accounts receivable, inventory, prepaid expenses—anything convertible to cash within one year.
- Fixed Assets (Long-Term): Equipment, vehicles, furniture, buildings—physical items used over multiple years.
- Intangible Assets: Patents, trademarks, goodwill—non-physical items with value.
Understanding Liabilities
Liabilities are what you owe to others:
- Current Liabilities: Accounts payable, credit card balances, short-term loans, accrued expenses—debts due within one year.
- Long-Term Liabilities: Mortgages, equipment loans, long-term leases—debts due beyond one year.
Owner's Equity
The difference between assets and liabilities. This represents your ownership stake—the value that would remain if you sold everything and paid all debts. It includes initial investment, retained earnings, and any additional owner contributions minus owner draws.
Key Balance Sheet Ratios
- Current Ratio: Current Assets ÷ Current Liabilities. A ratio above 1.0 means you can cover short-term debts. Between 1.5-3.0 is healthy for most small businesses.
- Debt-to-Equity Ratio: Total Liabilities ÷ Owner's Equity. Shows how much you're financing through debt vs. owner investment. Lower is generally safer, but some debt can fuel growth.
- Working Capital: Current Assets – Current Liabilities. The cash cushion available for daily operations.
The Cash Flow Statement
What it tells you: Where did cash come from and where did it go?
What it tells you: Where did cash come from and where did it go?
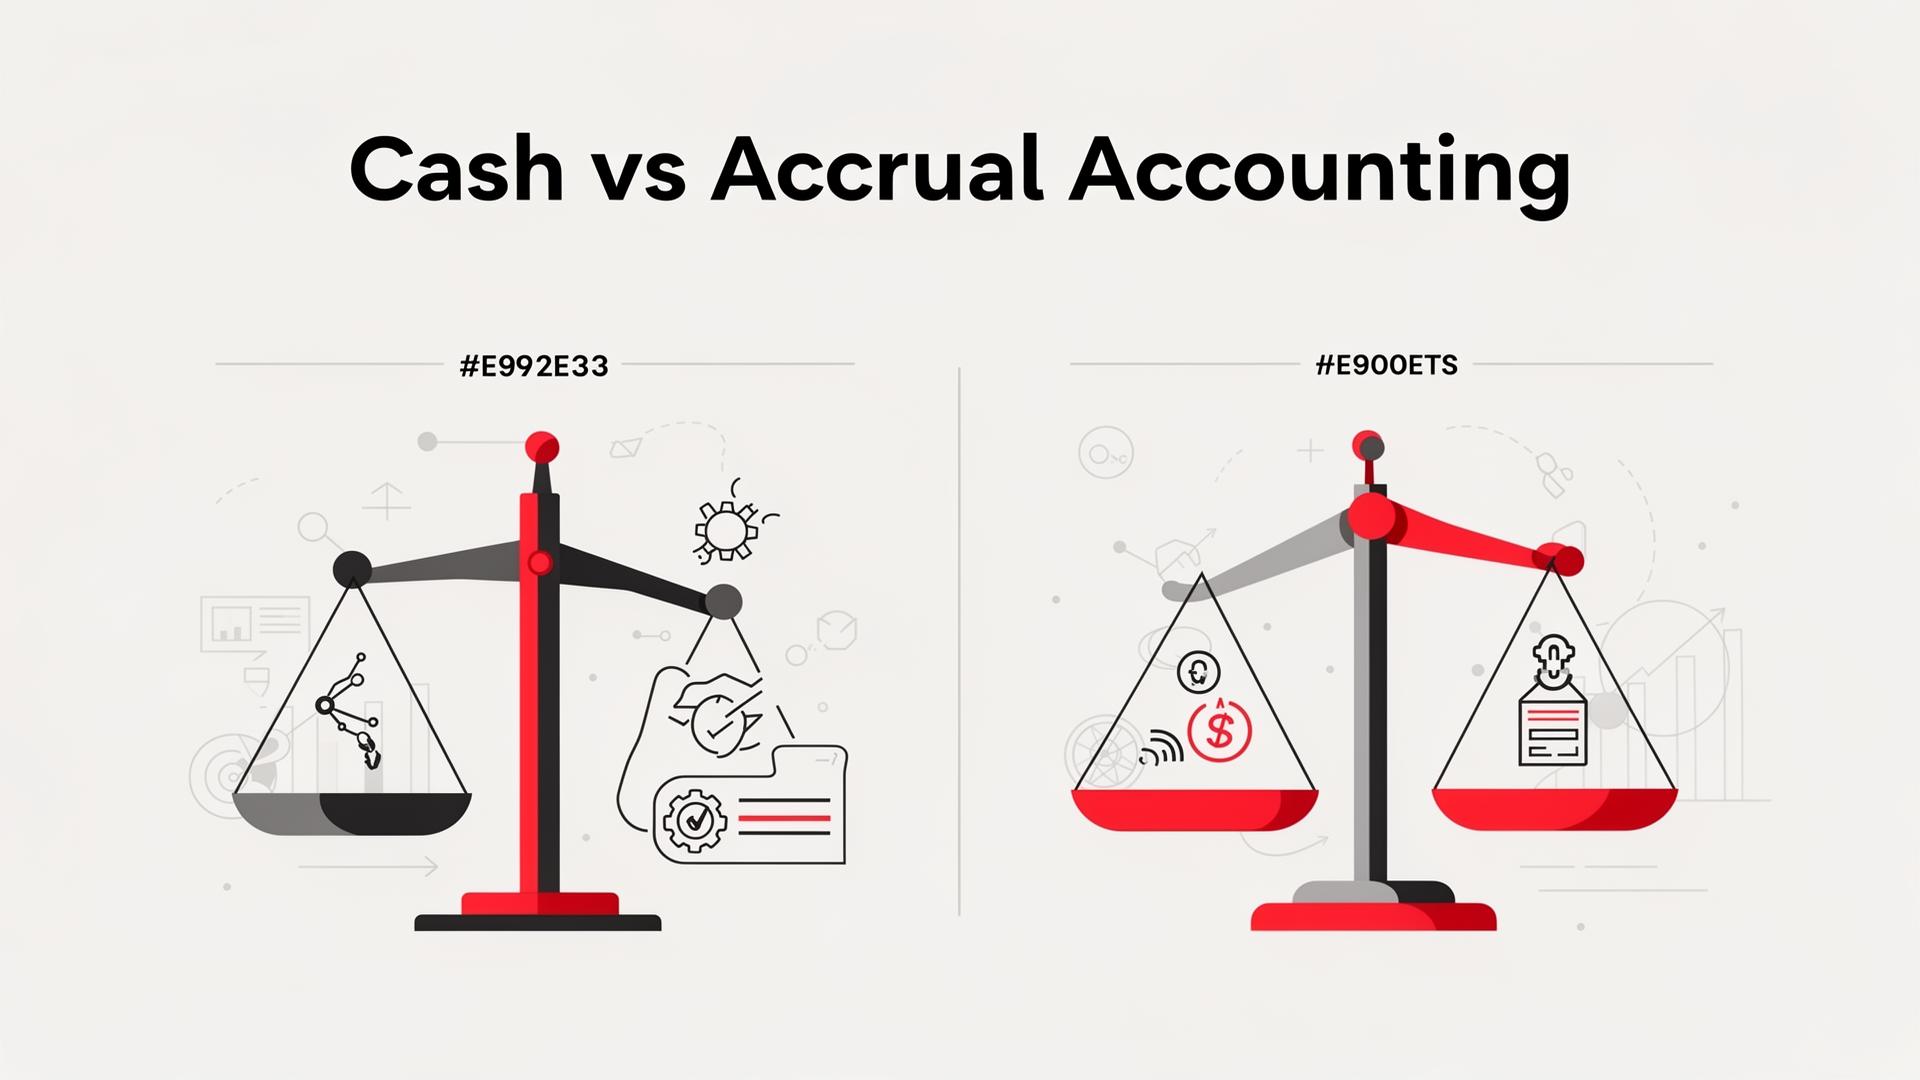
Here's a truth that catches many business owners off guard: profitable businesses can fail if they run out of cash. Your P&L might show healthy profits while your bank account runs dry—waiting on customer payments, buying inventory, or paying for equipment. The cash flow statement bridges this gap, showing actual cash movement regardless of when you recorded revenue or expenses.
The Three Sections of Cash Flow
- Operating Activities: Cash from your core business operations. This includes customer payments received, supplier payments made, payroll, rent, and other operating expenses. A healthy business generates positive operating cash flow—you bring in more cash from operations than you spend.
- Investing Activities: Cash used to buy (or received from selling) long-term assets. Buying equipment shows as negative cash flow; selling old equipment shows as positive. Growing businesses often have negative investing cash flow as they buy assets for expansion.
- Financing Activities: Cash from loans, investor contributions, or owner draws. Taking a loan is positive cash flow; repaying it is negative. Owner draws or dividend payments are negative.
How Profit Differs from Cash
Several timing differences cause profit and cash to diverge:
Several timing differences cause profit and cash to diverge:
- Accounts Receivable: You recorded revenue when invoiced, but cash hasn't arrived yet.
- Inventory: You paid cash for inventory before selling it.
- Depreciation: A non-cash expense that reduces profit but doesn't use cash.
- Loan Payments: Principal payments reduce cash but aren't expenses on the P&L.
Identifying Cash Flow Problems Early
Watch for these warning signs:
- Operating cash flow negative while profit is positive (you're profitable on paper but burning cash)
- Consistently needing to borrow to cover payroll or rent
- Growing accounts receivable faster than revenue (customers paying slower)
- Decreasing cash balance month over month despite profitability
Additional Reports for Small Business
Beyond the core three, several supplementary reports help you manage specific aspects of your business:
Beyond the core three, several supplementary reports help you manage specific aspects of your business:
Accounts Receivable Aging Report
Shows all unpaid customer invoices grouped by how long they've been outstanding: current, 1-30 days late, 31-60 days, 61-90 days, and over 90 days. Critical for cash flow management and collection efforts. Review weekly to identify problems before they become uncollectible.
Accounts Payable Aging Report
The opposite of AR aging—shows what you owe to suppliers and when it's due. Helps you prioritize payments, take advantage of early payment discounts, and avoid late fees or damaged vendor relationships.
Budget vs. Actual Comparison
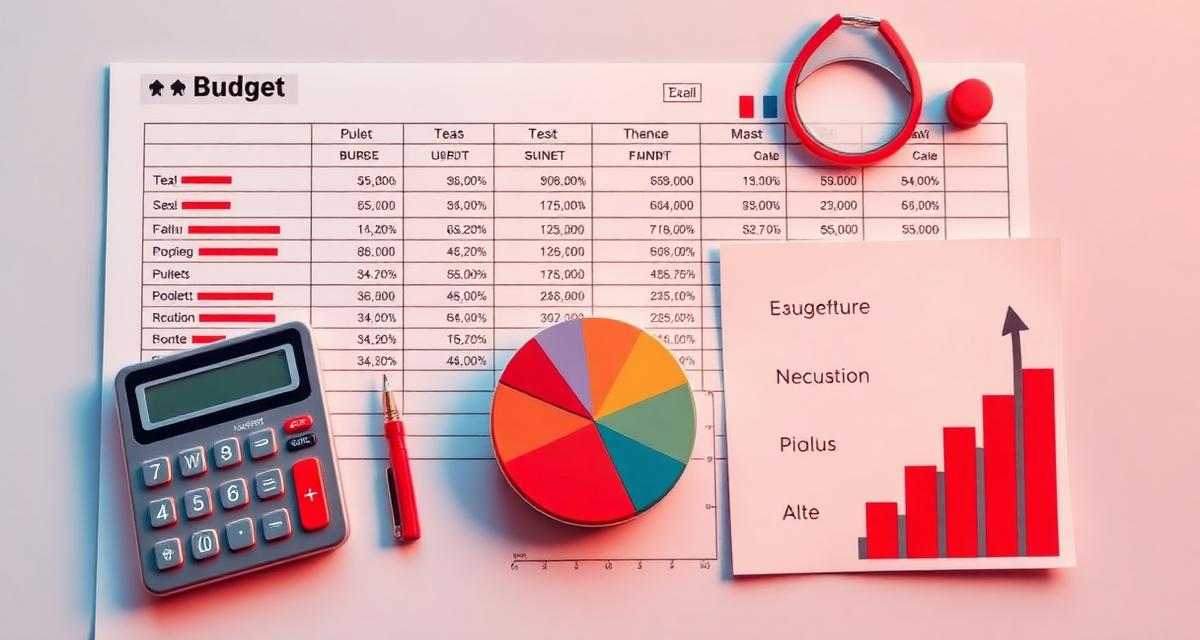
Compares your planned revenue and expenses against what actually happened. Large variances require investigation: Did you overspend? Did a revenue line underperform? Why? This report turns your budget from a planning exercise into a management tool.
Break-Even Analysis
Calculates the revenue needed to cover all costs with zero profit. Essential for pricing decisions, evaluating new products or services, and understanding the minimum viable sales level for your business.
How Often to Review Each Report
Different reports serve different purposes and require different review frequencies:
Different reports serve different purposes and require different review frequencies:
Daily Reviews
- Bank balance: Quick check to ensure no surprises and sufficient funds for upcoming payments.
- AR aging: Identify overdue invoices for immediate follow-up.
Weekly Reviews
- Cash flow projection: Rolling 4-8 week forecast of expected cash in and out.
- AP aging: Plan upcoming payments and manage vendor relationships.
Monthly Reviews
- Full P&L: Analyze revenue and expense trends, calculate key ratios.
- Balance sheet: Review asset and liability positions, calculate working capital.
- Budget vs. actual: Identify variances and take corrective action.
Quarterly Reviews
- Complete financial package: All three core statements plus supplementary reports.
- Trend analysis: Compare current quarter to previous quarters and same quarter last year.
- Strategic review: Are you on track for annual goals? What adjustments are needed?
Frequently Asked Questions
Do I need an accountant to create these reports?
Not necessarily. Modern accounting software automatically generates these reports from your transaction data.
Not necessarily. Modern accounting software automatically generates these reports from your transaction data. However, an accountant can help ensure your books are accurate, explain what the numbers mean for your specific situation, and advise on improvements. Many small business owners handle routine bookkeeping themselves but consult with an accountant quarterly or annually.
What software generates financial reports automatically?
Most small business accounting platforms—including Invoicemonk—automatically generate P&L statements, balance sheets, and cash flow reports. The key is consistent data entry: if your invoices, expenses, and bank transactions are recorded properly, reports generate with a few clicks.
Most small business accounting platforms—including Invoicemonk—automatically generate P&L statements, balance sheets, and cash flow reports. The key is consistent data entry: if your invoices, expenses, and bank transactions are recorded properly, reports generate with a few clicks. Look for software that also provides AR/AP aging and budget comparison features.
Which report matters most for my business?
All three core reports matter, but your immediate focus depends on your situation. Cash-strapped businesses should prioritize cash flow.
All three core reports matter, but your immediate focus depends on your situation. Cash-strapped businesses should prioritize cash flow. Businesses struggling with profitability need to analyze the P&L. Those seeking loans or investment must ensure the balance sheet is strong. The best approach is reviewing all three together—each provides context for the others.
Take Control of Your Business Finances
Understanding financial reports isn't optional for serious business owners—it's the difference between reacting to problems and preventing them. Start with the three core statements, establish a regular review routine, and add supplementary reports as your business grows.
Understanding financial reports isn't optional for serious business owners—it's the difference between reacting to problems and preventing them. Start with the three core statements, establish a regular review routine, and add supplementary reports as your business grows.
The investment in learning to read and use these reports pays dividends through better decisions, earlier problem detection, and greater confidence in your business direction.
Invoicemonk automatically generates all essential financial reports from your transaction data, making it easy to stay on top of your business finances without manual spreadsheet work. Get started today and gain the financial visibility your business deserves.
Related Resources
More in this series (16 articles)
From this series
Essential accounting and expense management knowledge for small business success.
Related Topics
Digital Marketing, SEO Specialist, Content Creator & Product Professional
Olayinka is a digital marketer, content creator, growth and SEO specialist with 10+ years helping businesses in Nigeria, the UK, the US, Australia, and Dubai achieve their goals online.